What Is pgbot? Read-Only Postgres Checkups

pgbot is a read-only Go binary that grades PostgreSQL health from Postgres own stats views, remembers baselines, and exposes it all to agents over MCP.
Table of Contents
pgbot is a single Go binary that connects to a PostgreSQL database read-only, reads the statistics views Postgres already keeps about itself, and prints a health report that leads with what's wrong. It went public on GitHub on 11 August 2026 and shipped six releases in its first week, ending that stretch at v0.2.1 on the 18th. If you've been told it's a natural-language query tool for your application data, that's the wrong picture, and it's worth correcting before you read further.
It never touches your rows. It reads pg_stat_statements, pg_stat_activity, and their siblings, computes findings from them in Go, and stops there.
Which puts it in an odd gap. Checking whether a Postgres instance is actually healthy has historically meant one of two things: pasting a query you found on a wiki into psql and squinting at the output, or buying a monitoring product that watches the host and infers the database from outside. The first has no memory and no opinion. The second costs money and still can't tell you that a specific index has been dead for a week. pgbot is the thing in between, and the interesting question is what it takes to run it in a way that pays off.
What is pgbot?
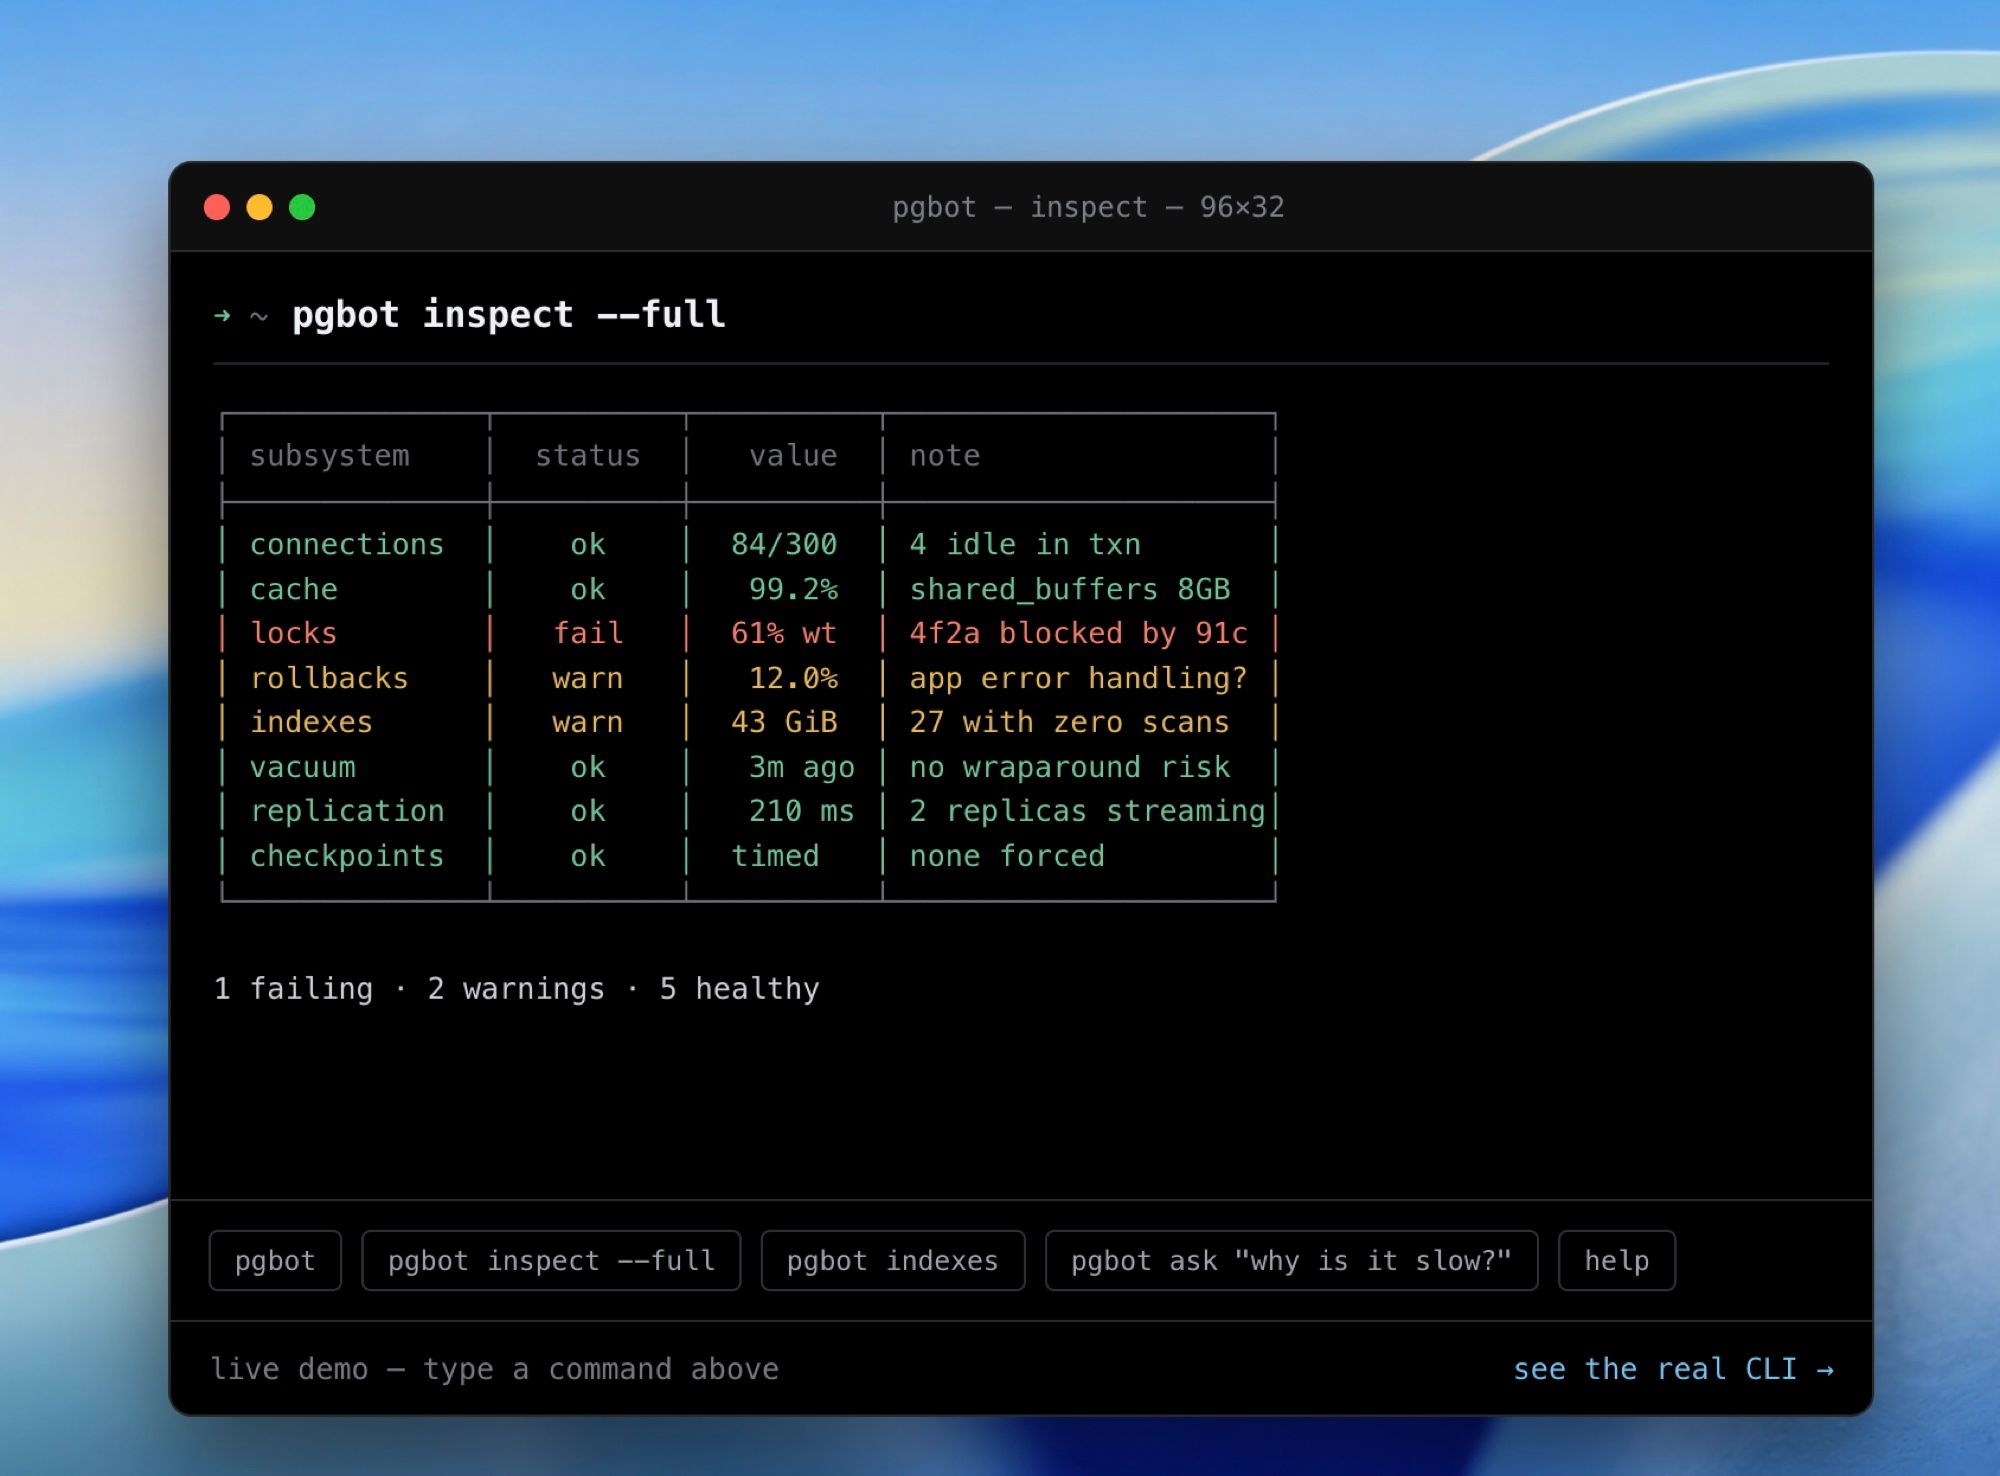
Run pgbot inspect against a connection string and you get a graded read rather than a wall of metrics: a health score out of 100, findings bucketed as CRITICAL, WARNING, and NOTE, then a GOOD list that names the subsystems it checked and found fine, with their values. A tool that tells you cache hit ratio is 99.4% and replication is healthy reads like a colleague who actually looked, not an alarm that only speaks when it's angry.
The findings themselves are the ordinary Postgres failure modes, stated in the terms an on-call engineer would use. Transaction-id age at 84% of the way to wraparound. A table's queries running 3.2 times slower than they did six hours ago. Three unused indexes sitting on 18 GB. Connection usage touching 87%. Each line carries an id, so pgbot explain-finding low_hot_update_ratio pulls the reference page for it straight out of the binary, offline.
Why a single run tells you almost nothing
The thing that decides whether this tool is worth anything to you isn't visible in any screenshot. Every run writes a local baseline, so from the third run onward it stops reporting numbers and starts reporting changes. The store sits at $XDG_STATE_HOME/pgbot/baselines.db, holding seven days at full resolution, hourly rollups out to ninety days, under a 100 MB cap.
Read that back and the consequence is uncomfortable. A cache hit ratio of 99.4% means nothing on its own; you have no idea whether it was 99.9% yesterday. The finding that actually saves you, the one where a table's queries got 3.2 times slower in six hours, only exists if something was there to take the earlier measurement. A baseline assembled from whenever you happened to open a terminal is a baseline full of holes, and holes are exactly where the regression hides.
So the tool quietly imposes a requirement that has nothing to do with Postgres: you need a machine that's awake at 04:00 and a place for that baselines.db file to live between runs. A laptop that sleeps every evening fails both. This is the same argument as any scheduled job that has to keep state, and it's the half of the problem a hosted cloud AI computer such as MoClaw exists to answer: not because it knows anything about databases, but because the cron entry and the baseline file need somewhere that doesn't close at 6pm. Nothing in pgbot is wired to MoClaw; the requirement is what they share.
The exit codes point the same direction, since they're explicitly a CI contract, and scheduling that contract is its own topic (see AI cron jobs): 0 clean, 1 warnings, 2 critical, 3 connection failure, 64 usage error. Suppressed findings never count toward them. That's a design for something running unattended on a timer, which is a different thing from a command you type when you're already worried. The moment you wire those exit codes to anything that pages a human, the reliability of the box running them becomes part of your monitoring story, which is an argument for a MoClaw style always-on host rather than a spare laptop under a desk.
Connectivity is the other half of where. pgbot is a client speaking the Postgres wire protocol, so nothing gets installed on the database and the docs are refreshingly specific about the consequences: for a private RDS instance you run it from a small EC2 in the same VPC, no SSH tunnel and no IP allow-listing, with the only rule being a security group that permits 5432. Whether that box is an EC2 you patch or a hosted machine like MoClaw that someone else keeps alive is a preference, but it has to be a box, and it can't be your laptop on hotel wifi.
The read-only guarantee is a role, not a flag
Installing it is uninteresting: six documented paths, five of them one-liners (npx, the install script, Homebrew, go install, Docker) and a manual archive download for Windows. Only one of them verifies anything. The npm route carries registry integrity hashes and npm provenance, which attests where the package was built rather than that the artifact was signed; the install script is the verified path, since releases ship SHA256 checksums signed with cosign through GitHub Actions OIDC, and setting PGBOT_REQUIRE_SIGNATURE=1 makes it hard-fail when cosign is missing. Very few tools of this size bother to draw that distinction in their README.
What matters more is that the read-only promise isn't a flag you can forget to pass. It's the database role:
CREATE ROLE pgbot_ro LOGIN PASSWORD '...';
GRANT pg_monitor TO pgbot_ro;
GRANT CONNECT ON DATABASE yourdb TO pgbot_ro;
Without pg_monitor a non-superuser only sees its own sessions in pg_stat_activity, so it detects the missing grant at connect time and tells you which statement to run rather than quietly reporting half the picture. On top of the role the tool pins each session with default_transaction_read_only, a 15-second statement_timeout, and a 2-second lock_timeout, and wraps every query in its own BEGIN READ ONLY. Those are defence in depth. The role is the actual boundary, and the docs say so plainly instead of selling the flags as safety.
One small oddity to flag: pgbot.dev's header badge reads OPEN SOURCE · GO · MIT, while the LICENSE file in the repository and the README both say Apache-2.0 instead. Go by the LICENSE file.
What a run actually tells you
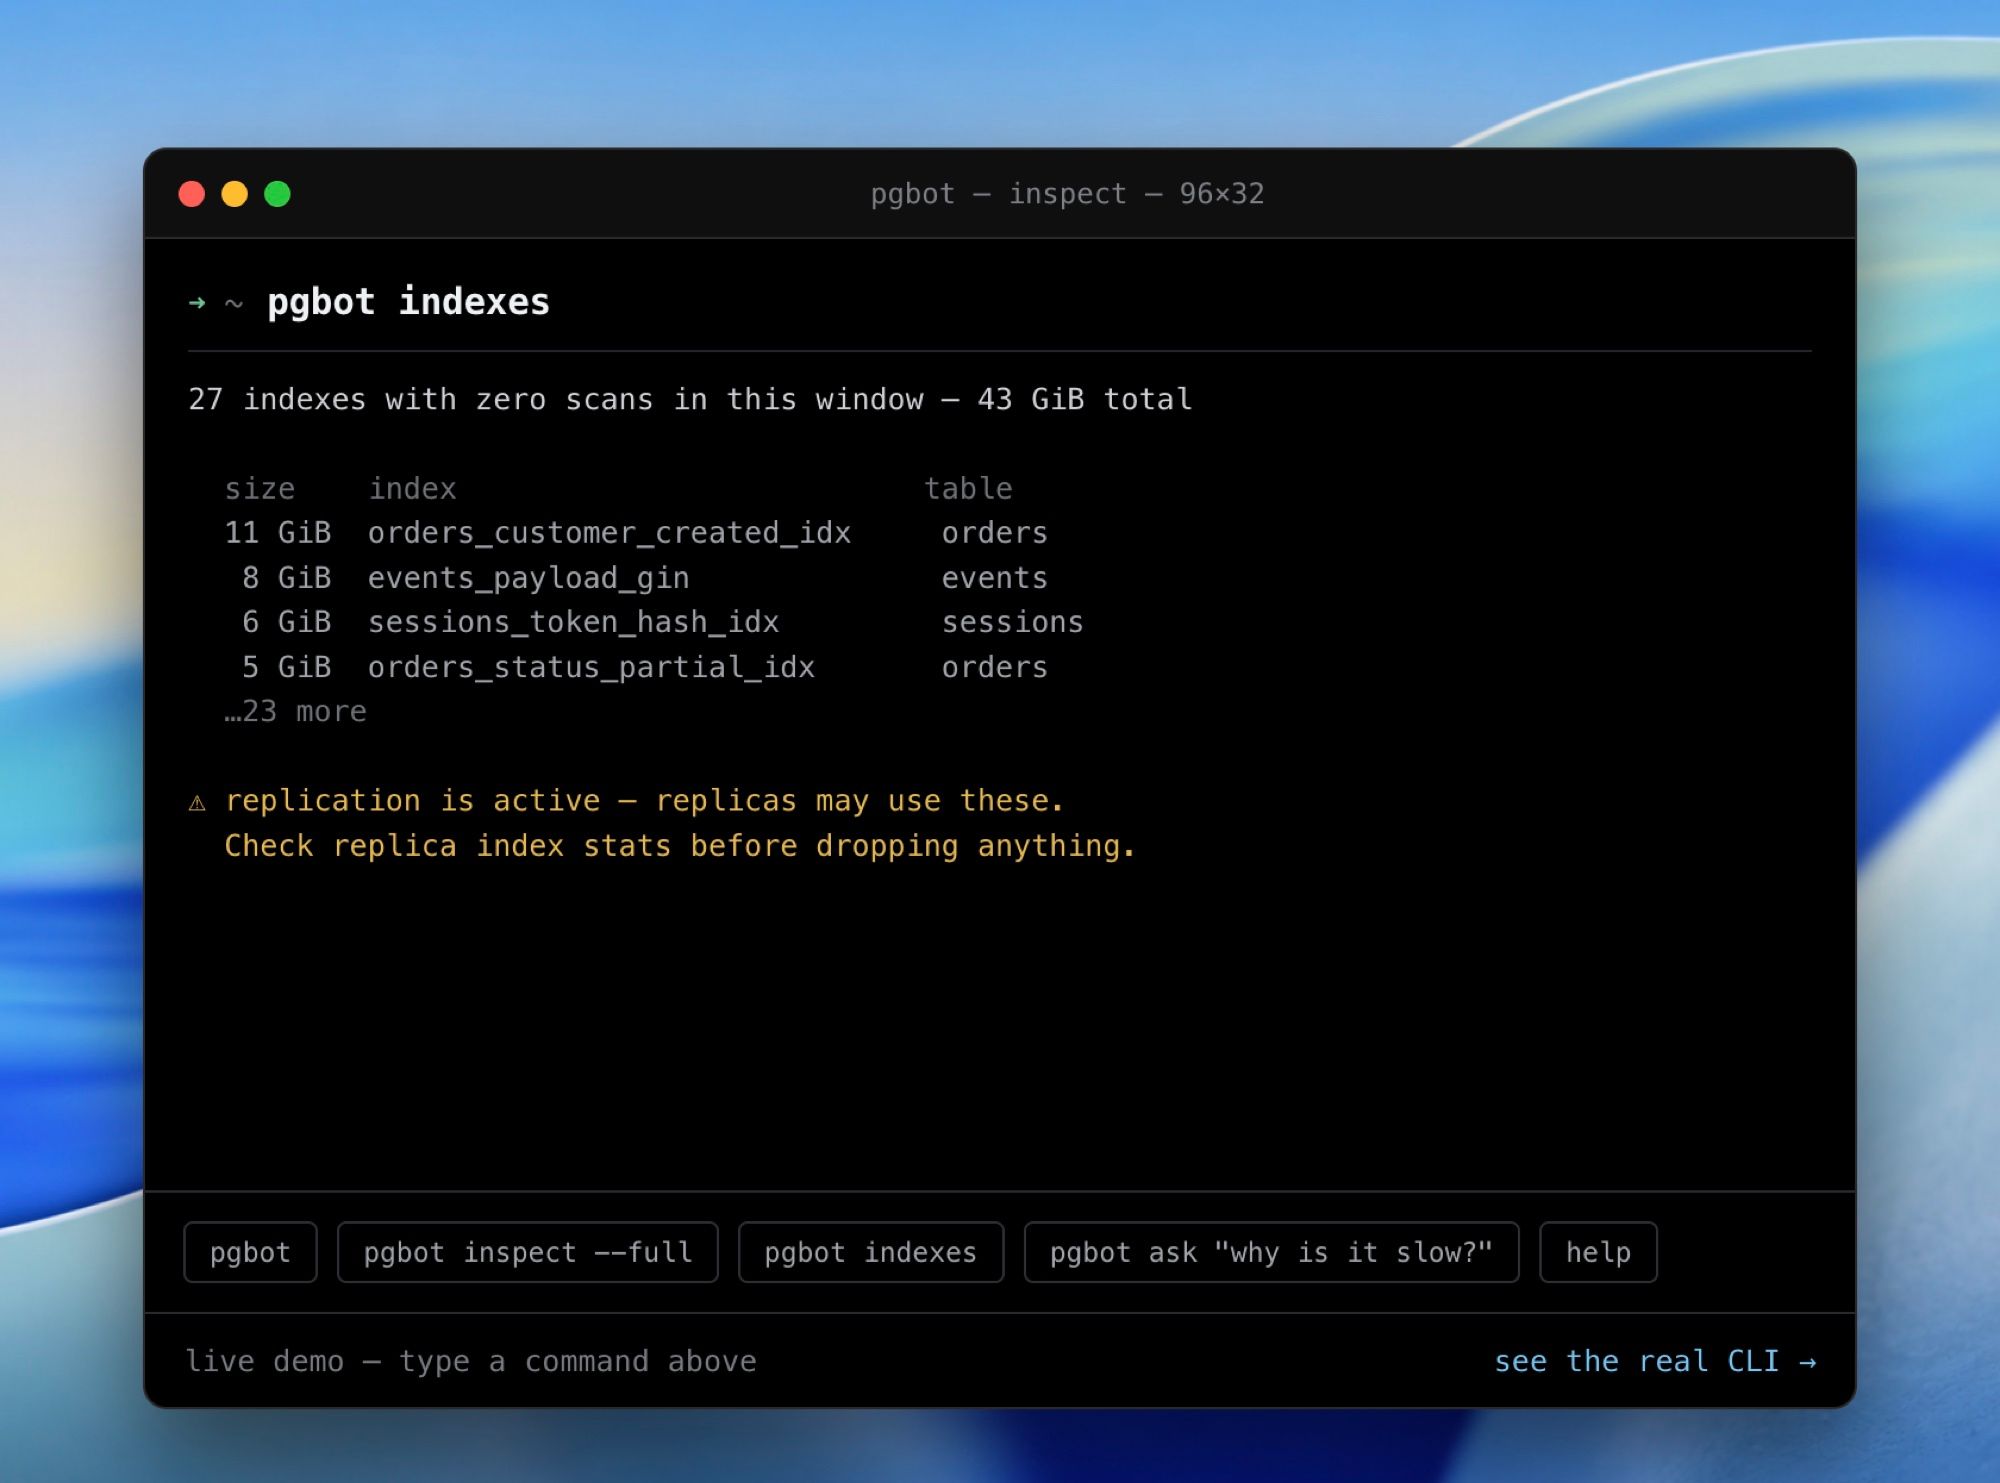
Six focused subcommands each drill into one signal, and they behave the way you'd guess from the names, so the tour isn't worth your time: indexes, queries, tables, vacuum, tune, advise. Two details in there aren't guessable. The index report tells you what not to drop, because scan counts on a primary are per-node and an index that looks dead may be carrying a replica's read traffic; that caveat travels with the finding rather than living in a footnote. And vacuum computes a due? column by comparing dead tuples against Postgres's own default autovacuum threshold of 50 plus 20% of live rows, which turns bloat from a thing you notice too late into a column you can sort by.
Then there's pgbot advise, the one I'd point a sceptic at. It reads the slowest queries, derives candidate indexes from the planner's own sequential-scan filters in Go with no model involved, and then validates each candidate by creating it hypothetically with hypopg, re-planning the query, and reporting it only if the planner actually switches and the cost drops. Nothing gets built. It plans with EXPLAIN (GENERIC_PLAN) and never executes your query. Requires PostgreSQL 16 or newer, plus hypopg and pg_stat_statements; when any of those is missing it prints what to enable and does nothing else.
Everything above is also available as --json, a versioned, PII-free document the author calls the contract for agents and scripts. That turns out to be the load-bearing decision in the whole project.
Giving an agent pgbot as an MCP tool
pgbot mcp runs a Model Context Protocol server over stdio, the same plumbing covered in MCP tools explained, and the tools it exposes are deliberately dumb: inspect, unused_indexes, top_queries, vacuum_health, suggest_indexes, explain_plan, schema_of, compare_to_baseline, explain_finding. All read-only, all returning a stable JSON shape carrying an exactness label, none of them exposing a raw connection string or a query literal to the model. schema_of returns columns, indexes, constraints, and a row estimate, with no data.
The split is the point. The binary computes findings deterministically; the connected model does the explaining. explain_finding even hands the agent the tool's own catalogue page for a recommendation so it explains the finding in the project's own words instead of inventing a justification. Anyone who has watched an agent confidently recommend dropping an index that a replica depends on will recognise what that's guarding against.
Wiring it up is the ordinary mcpServers entry, with pgbot mcp as the command and the read-only DATABASE_URL in the environment; if you have ever added an MCP server by hand, you already know what it looks like.
Claude Code users can skip even that: the repository is its own plugin marketplace, so claude plugin marketplace add pgrundev/pgbot followed by claude plugin install pgbot@pgbot registers the MCP tools, a postgres-diagnostics skill, and three slash commands. The plugin drives the binary, so install that first. And the hosting question resurfaces one level up, because an MCP server is a process someone has to keep running; if the agent is meant to answer "is production healthy?" at any hour, that process belongs on a machine that doesn't close at night, which is the niche MoClaw occupies.
Where the AI sits, and where it doesn't
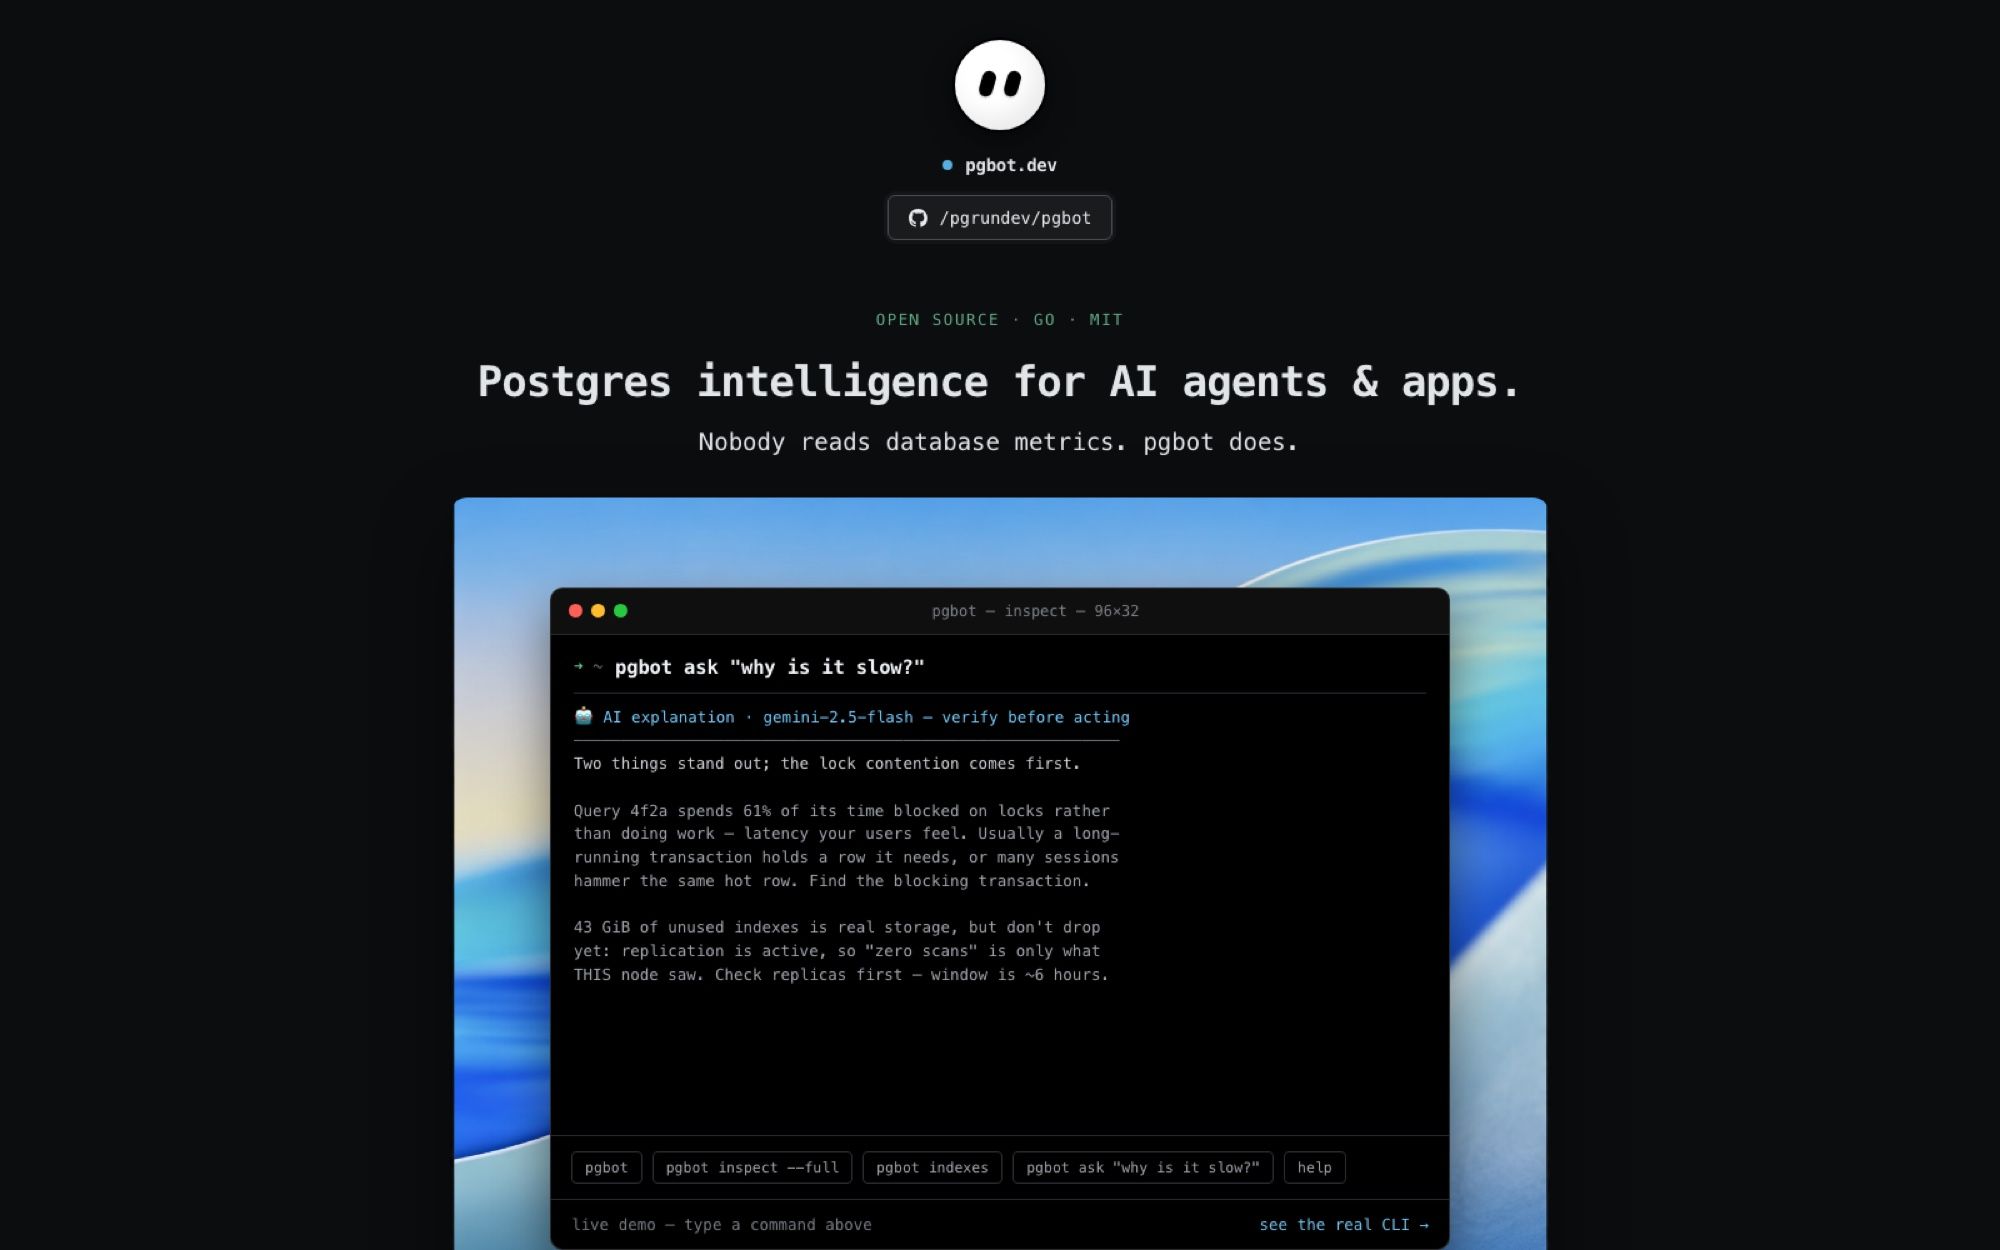
Only two commands leave the machine: pgbot explain and pgbot ask. Both send the same PII-free Context you can inspect yourself with --json, to OpenAI or Google Gemini depending on which key is in your environment, and ask prompts for confirmation before it does. Everything else is entirely local.
The Context is scrubbed by construction, not by promise: pg_stat_statements text arrives already normalised to $1 placeholders, and the one raw-SQL source, pg_stat_activity for blocking chains, gets stripped of string and numeric literals, emails, and UUIDs before it can enter the Context. Connection strings are redacted in every log and error path.
When the model does speak, its output prints below a labelled rule reading generated by … — verify before acting, and the deterministic report above it stands unchanged whether the model answers, errors, or never gets a key at all. Reverse that ordering and you'd have a very different product.
What it won't do
Host metrics are out of reach, because CPU, memory, and disk IOPS don't live in Postgres. On managed databases they sit behind the provider's API, and the README says an agent-on-host is future work rather than pretending a SQL connection can see them.
It never writes. It recommends indexes; building them is your job, off-peak, with CONCURRENTLY. Deeper correlation between findings is listed as unbuilt. And on scale-to-zero databases such as Neon, statistics get discarded when the compute suspends, so the deltas section is suppressed entirely after a reset and counter-based findings are held back during a cold window younger than fifteen minutes, on the grounds that a counter dropping from 40M to 12k is a wake, not a regression.
For a tool eight days old, that list of admitted edges is the most reassuring thing in the documentation. What the docs can't hand you is the boring half: a role with the right grant, a schedule that keeps firing, and a host that's still up at 4am so the baseline has something to compare against. The first one takes three lines of SQL. For the other two, a hosted cloud AI computer like MoClaw is the cheapest way to stop thinking about it.
FAQ
Is pgbot free and open source?
Yes. The LICENSE file in the repository is Apache-2.0 and the README agrees, though the badge on pgbot.dev says MIT. No paid tier is advertised.
Which databases does pgbot support?
PostgreSQL only, over the wire protocol, which covers self-managed instances plus AWS RDS and Aurora, Neon, and Supabase. The docs carry per-provider notes, including pooled-endpoint detection for Supabase on port 6543 and Neon's -pooler hosts. pgbot advise additionally needs PostgreSQL 16 or newer.
Is it safe to let an AI agent query my production database through pgbot?
The boundary you rely on is the pg_monitor role with no write grants, not the tool's own restraint. That framing matches the permission-boundary rules in our AI agent security framework. Given that role, the MCP tools are read-only, return no table data beyond schema and row estimates, and never hand the model a connection string. pgbot explain and pgbot ask are the only commands that send anything off the machine.
Does pgbot let me query my data in plain English?
No, and this is the most common misreading. It answers questions about database health from Postgres's own statistics views. It doesn't translate English into SQL over your application tables.
Do I have to install anything on the database server?
No. It's a client like psql, so you run it from a laptop, a bastion, CI, or an instance in the same network. Managed providers that give you no OS access are fine for exactly this reason. The catch isn't installation, it's that the baseline only becomes useful when the runs keep happening, which argues for a machine that stays up rather than the one you close at night.
Continue Reading
More Guide
Claude Model Upgrades: Protect Recurring AI Workflows

Relay.app Alternative: Move Before Sep 14

What Is Cumora? AI Agents as Teammates

Mistral OCR: Your Version Gates Features

Kimi K2.6 Pricing Hides a Precision Trade

Grok 4.6 Doubles Its Price at 200K Tokens
The MoClaw editorial team writes about workflow automation, AI agents, and the tools we build. Default byline for industry overviews, listicles, and collaborative pieces.
Ready to put this into practice?
MoClaw runs browser tasks, research, and schedules automatically. Try it free.
References: https://github.com/pgrundev/pgbot · https://pgbot.dev · https://github.com/pgrundev/pgbot/blob/main/LICENSE · https://github.com/HypoPG/hypopg · https://modelcontextprotocol.io