Auto-Filled QBR Template
Upload last quarter's <a href="/blog/ai-agent-use-cases-2026-guide">QBR and this quarter's</a> numbers, and get the same deck back with every chart redrawn and the conclusions rewritten.
Runs on managed cloud. No scripts, no Zapier.
This is a refresh, not a rebuild. The previous deck is the anchor: layout, order and voice stay locked. What changes is the data behind each chart and the narrative, and the narrative has to follow the numbers rather than last quarter's story.
Used 1 tools
Read Northstar_QBR_June.pptx, Finance_July.xlsx, CRM_Pipeline.csv, Customer_Health.xlsx
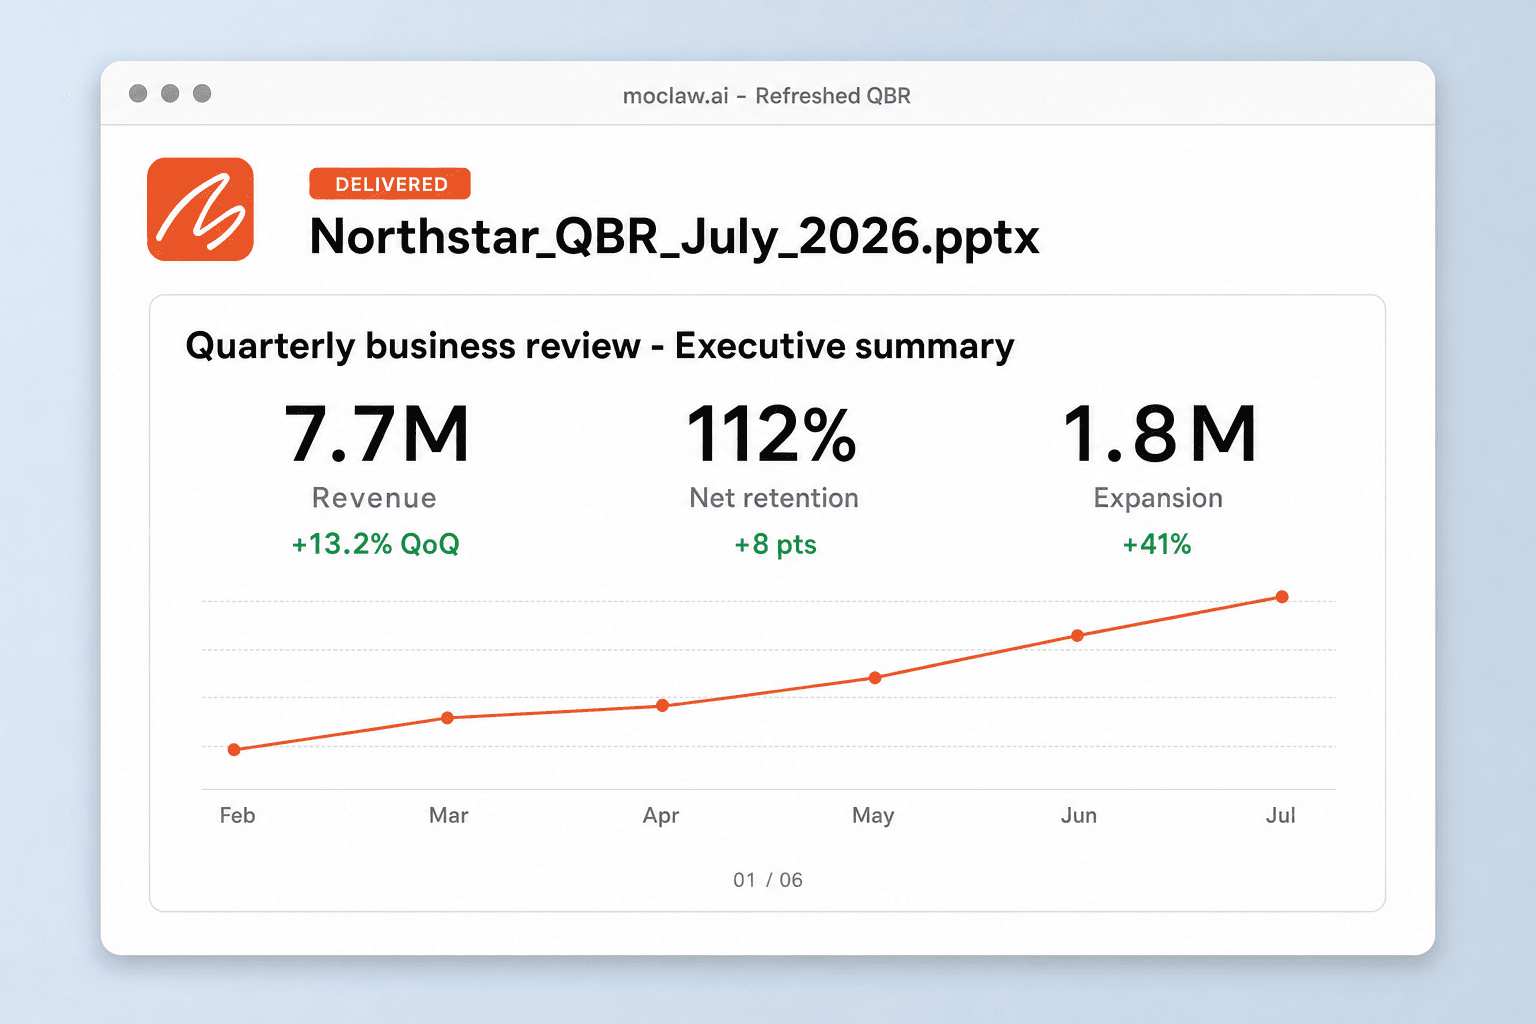
6 slides, 12 charts, 4 written conclusions. New data through July 2026: revenue 7.7M (+13.2% QoQ), net retention 112% (+8 pts), expansion 1.8M (+41%), new-logo volume flat.
The interesting part: revenue is up 13.2% but new-logo volume barely moved. The step-up came from expansion and retention, which is a different story than last quarter's deck tells. I'll rewrite the conclusions to say that rather than leaving June's narrative in place.
Used 1 tools
Write Redrawing 12 charts and recomputing deltas against the July data
12 charts refreshed, 4 conclusions revised, template preserved. Each figure linked to its source cell.
Same template, new quarter. The executive summary now reads: expansion, not new-logo volume, drove the step-up. Revenue rose 13.2% while new-logo volume was flat, so the acceleration came from enterprise expansion and improving retention, and the suggested next focus is enterprise feature adoption before the renewal cycle.
Every number traces to a source cell, so 13.2% points at Finance!I24. The change log lists all 12 chart updates. Adjust the judgment where you disagree and I'll fold it in.
- Same template, new quarter. The executive summary now reads: expansion, not new-logo volume, drove the step-up. Revenue rose 13.2% while new-logo volume was flat, so the acceleration came from enterprise expansion and improving retention, and the suggested next focus is enterprise feature adoption before the renewal cycle.
- Every number traces to a source cell, so 13.2% points at Finance!I24. The change log lists all 12 chart updates. Adjust the judgment where you disagree and I'll fold it in.
How the QBR template works
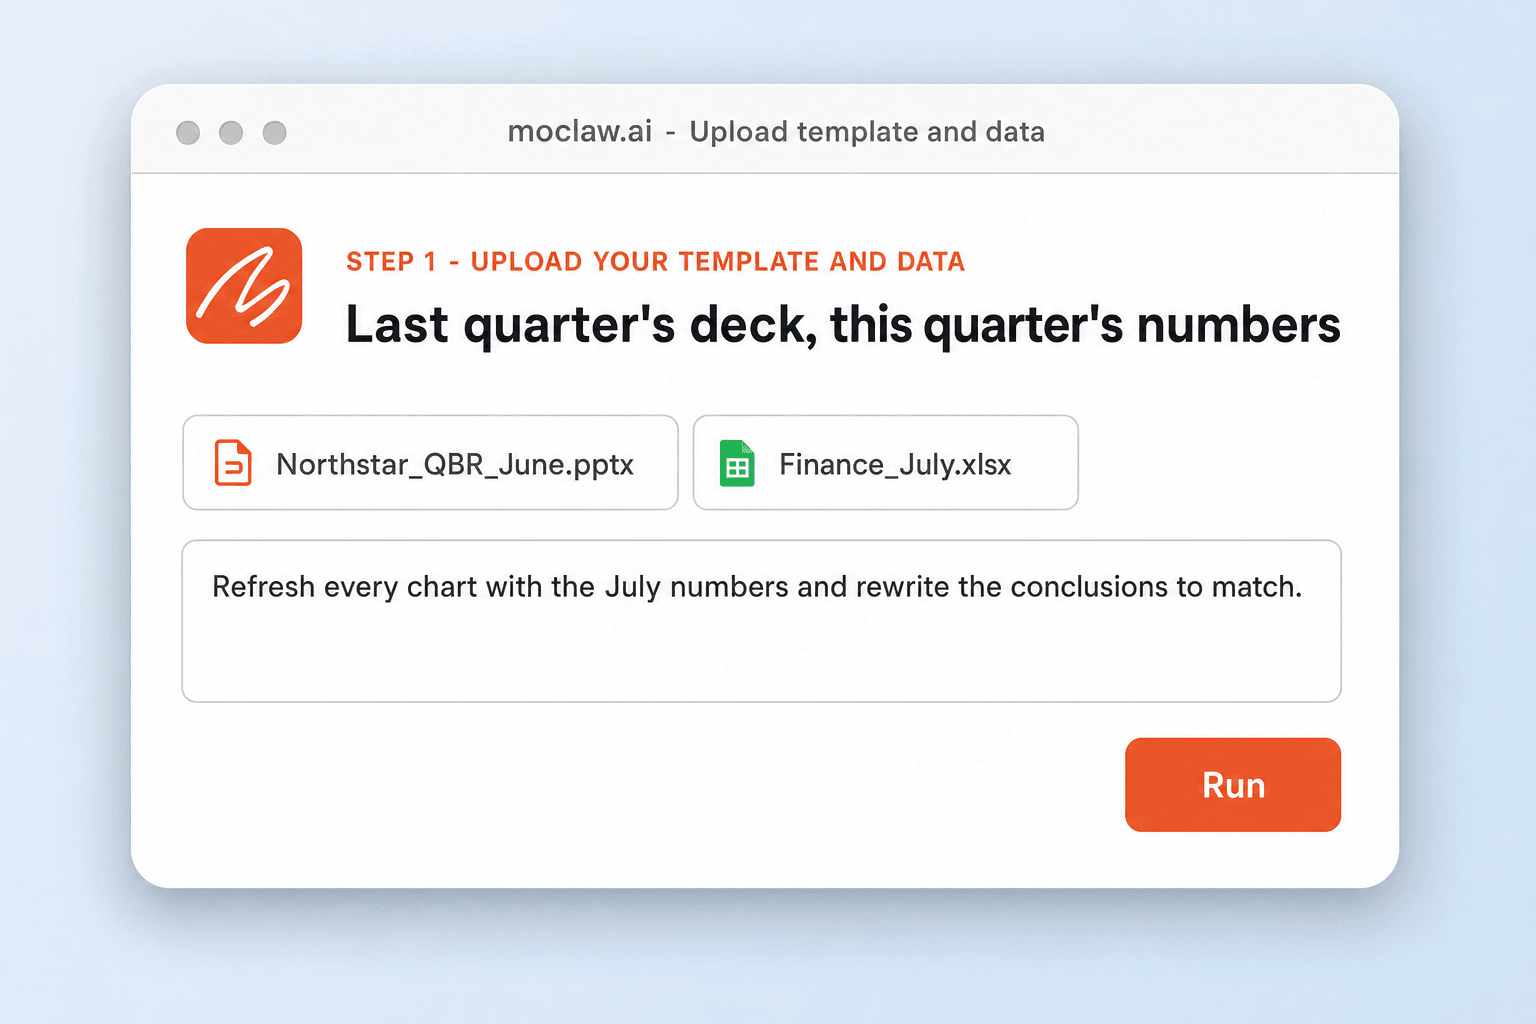
Upload Your Template and Data
Drop in last quarter's QBR, or start from a standard structure, plus this quarter's spreadsheet or CSV export.
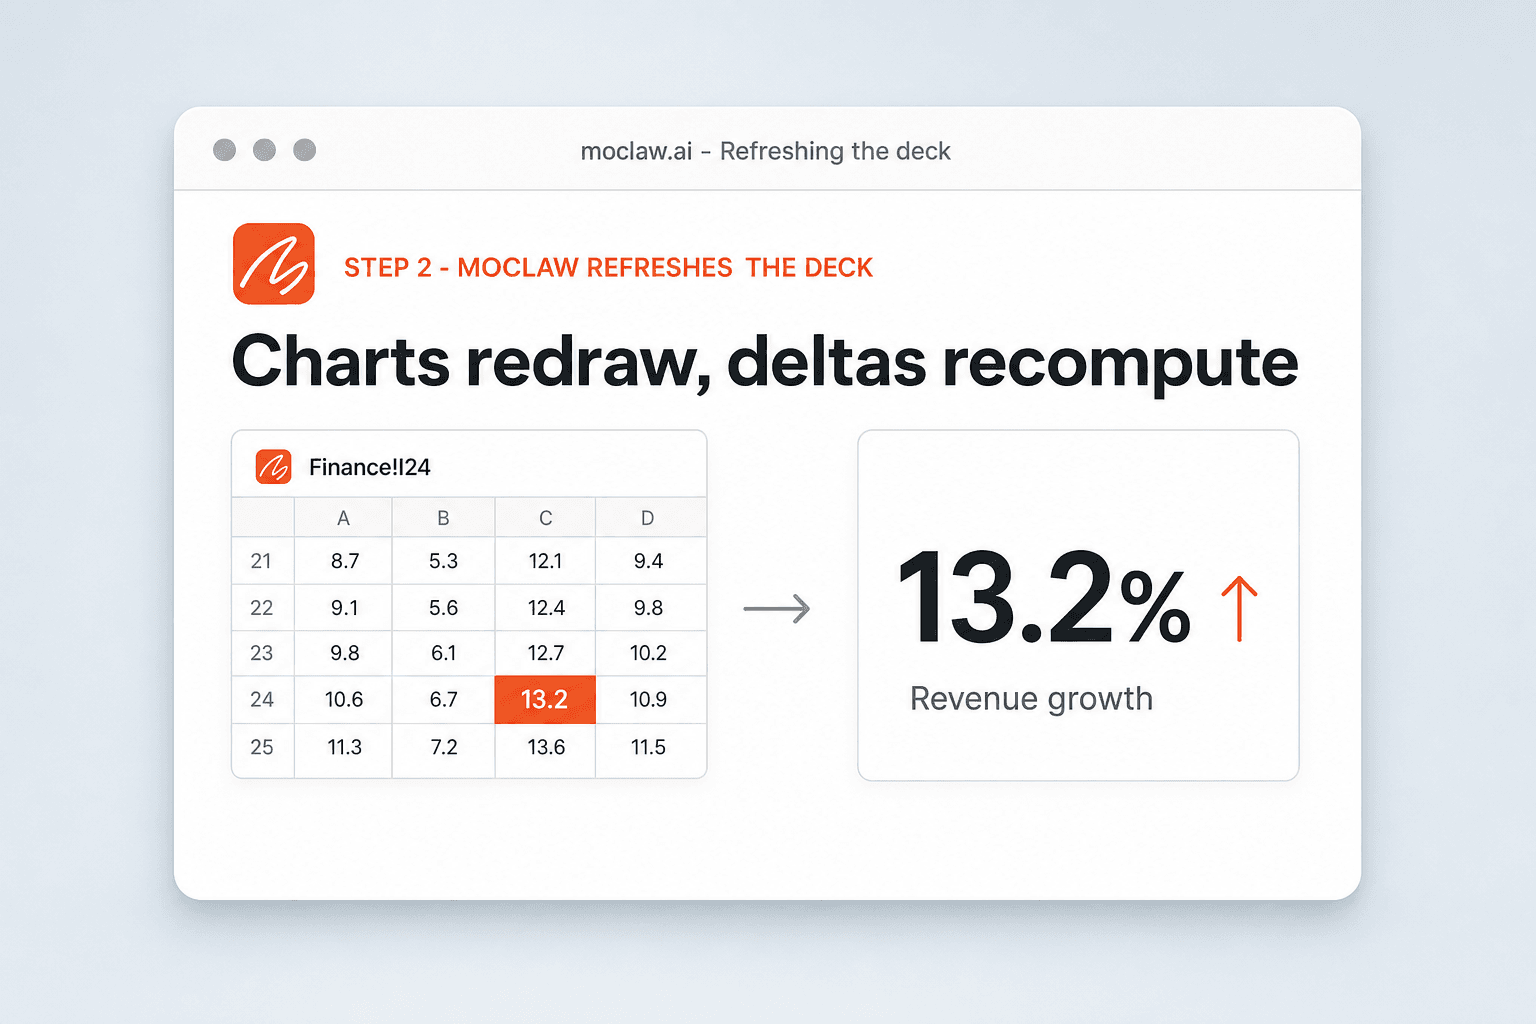
MoClaw Refreshes the Deck
Charts redraw from the new numbers, deltas recompute, and the conclusions are rewritten to match what the data actually did this quarter.
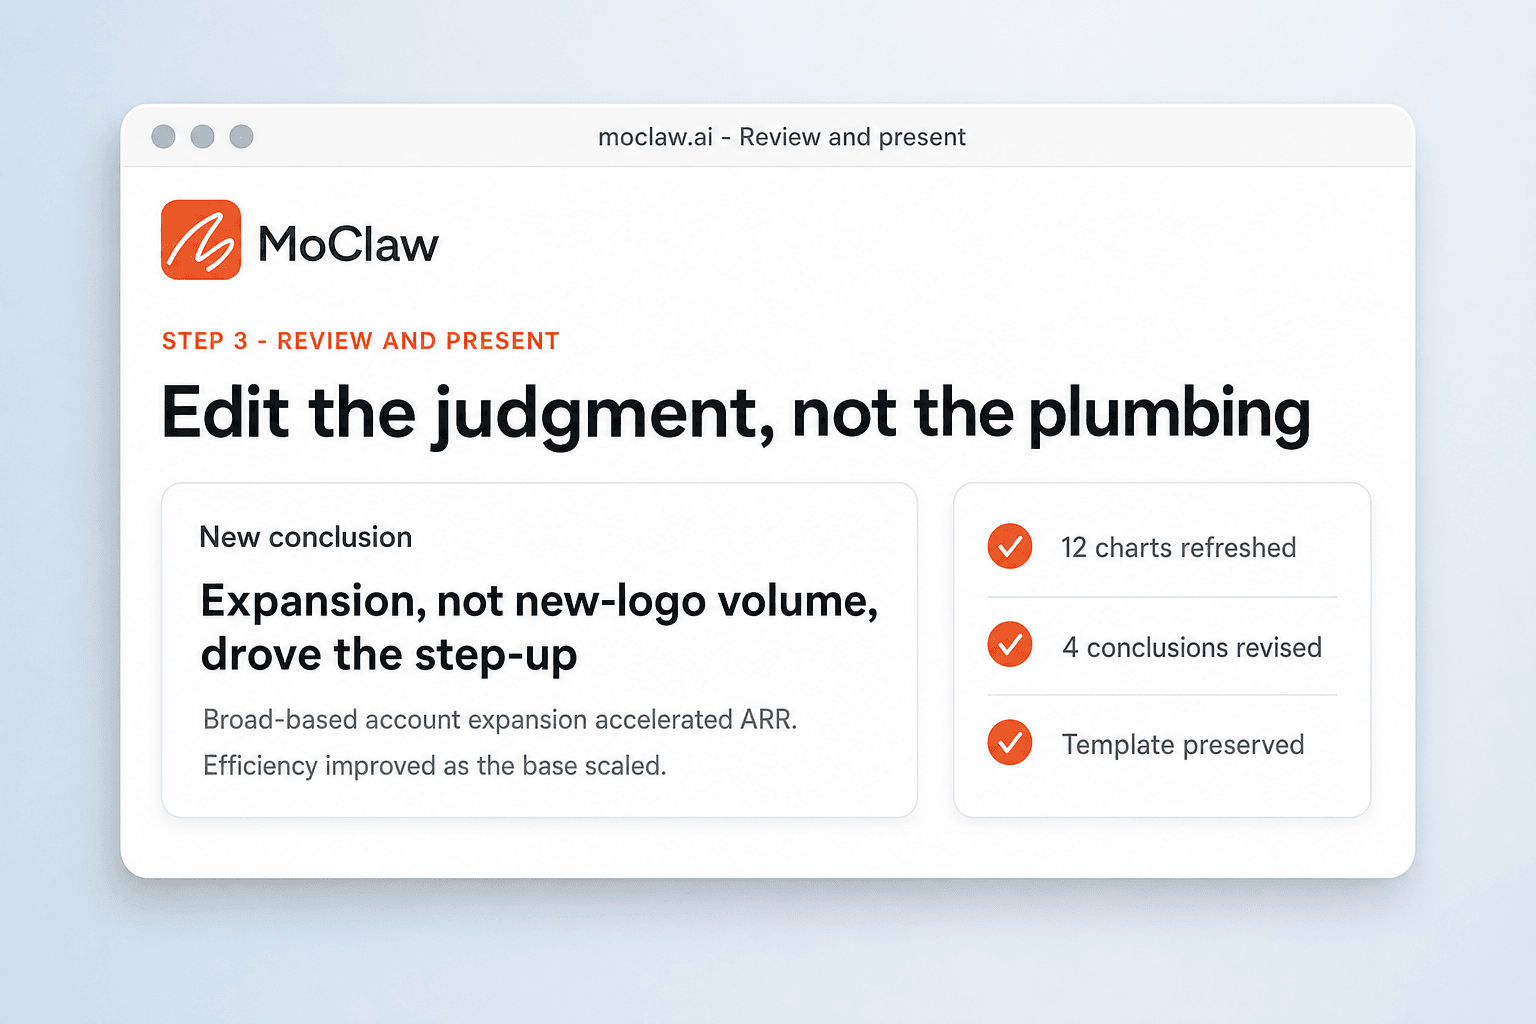
Review and Present
Check the change log, adjust the narrative where your judgment differs, and export the finished .pptx. Same template, new quarter.
What the refresh covers
What your QBR template sends you
A real example of what MoClaw hands back, shown before you sign up.
QBR template: MoClaw vs blank QBR templates
See how MoClaw's AI-powered approach differs from traditional tools.
| Feature | Rebuilding each quarter | Blank QBR template | MoClaw |
|---|---|---|---|
| Where you start | Last quarter's file, edited by hand | An empty outline | Your own deck, refreshed |
| Charts | Re-pasted from the spreadsheet | Placeholders | Redrawn from this quarter's export |
| The written takeaway | Rewritten under time pressure | Left to you | Drafted from what the numbers did |
| Traceability | You remember where it came from | None | Each figure linked to a source cell |
| The tenth version | Drifts from the first | Starts blank again | Same structure, locked |
Why a QBR is a refresh problem, not a blank-canvas problem
The tenth version of a recurring deck matters more than the first.
A Deck That Remembers Itself
Template tools give you a starting point and then forget you. MoClaw keeps your previous deck as the anchor, with the layout and voice locked, so this quarter looks like last quarter on purpose.
Built for the Recurring Report
One-shot generators optimise for the first deck. A QBR is the opposite problem, which is why this is built around the refresh.
Hours Back, Every Quarter
The manual loop of export, copy, paste, re-chart, and rewrite costs a day per quarter per deck. Upload and review takes minutes.
Ways to extend your QBR template
Click one to load it into the box above, ready to run.
QBR template FAQ
How does the QBR template fill itself? ⌄
Upload last quarter's deck and this quarter's numbers. MoClaw redraws the charts, recomputes the deltas, and rewrites the conclusions inside your existing template. Sign up free to run it and keep editing the deck.
What is a quarterly business review? ⌄
A recurring deck reviewing goals, results, risks, and next steps for a business or an account. The point is that it repeats, which is why refreshing it matters more than generating it once.
What should a QBR include? ⌄
Goals, the KPIs that track them, wins, risks, and the plan for next quarter. Those sections get filled from your numbers rather than left as headings.
How do I write a QBR quickly? ⌄
Skip the rebuild. Upload the spreadsheet and last quarter's deck, then spend your time on the judgment calls in the narrative instead of on the formatting.
How is this different from a blank QBR template? ⌄
A blank template still needs a day of populating. This one arrives with your numbers in it, charts drawn and takeaways written, so you refine rather than format.
Can it pull numbers straight from my spreadsheet? ⌄
Yes, and each figure in the deck stays linked to the cell it came from, so a question in the room has an answer.
How does the quarterly refresh work? ⌄
Next quarter, upload the fresh export and the same structure is refilled. The template, tone, and slide order stay locked so the series stays consistent.
Is there a free QBR template to try? ⌄
The free tier lets you fill one and preview the result before moving to a paid plan.
Integrations
Best integrations for QBR template
Who it's for
Who uses QBR template
Related document automation use cases
From our blog
Try Auto-Filled QBR Template for free
No credit card required